Water Vapour Measurements
Instrumentation
There are currently three types of hygrometers in use on the FAAM aircraft. Two of these are chilled mirror hygrometers (the General Eastern 1011B, and the Buck CR2), the third is the Water Vapor Sensing System (WVSS-II) from SpectraSensors. The Buck CR2 and WVSS-II are used in combination to produce a calibrated volume mixing ratio measurement with a response time of around 2 s. The General Eastern hygrometer is operated as a backup instrument.
General Eastern
The 1011B thermoelectric hygrometer measures the dewpoint of ambient air using the chilled mirror technique. Air is sampled using a passive inlet, nominally free of any particles, and passed over a mirror. The mirror is thermoelectrically cooled until it reaches a temperature at which condensation begins to form (the dew or frost point), and is then held at that temperature. The presence of condensation is sensed optically. By definition this is an absolute measurement of dewpoint temperature.
An inlet is mounted on the aircraft skin permitting sampling of the ambient airstream. A pressure gradient is created in flight using the difference in flow across two ports, and the ambient air is thus passed through the internal portion of the inlet containing the mirror and sample optics. A control module is mounted on the Aft Core Console providing a visual display of the humidity as well as a user interface. Power for these components is supplied by a further electronics unit on the aft core console, which also outputs the measurements to the aircraft data system.
GE “dewpoint” data are recorded at 4 Hz by the aircraft data recording system. “Dewpoint” measurements output by the GE, parameter TDEW_GE are in fact readings of the mirror temperature. Under many circumstances this is almost equivalent to dew/frost point with the following caveats:
The GE is nominally capable of measuring data in the dew point range -75 to +50 \(^\circ\text{C}\). Its actual capability is strongly dependent on the ambient temperature and the instrument data are typically subject to increasing positive bias below around -25 \(^\circ\text{C}\), possibly due to temperature effects in flight. The instrument time response depends on the phase of the condensate layer and the mirror temperature. At dewpoints around 0 \(^\circ\text{C}\) the response time might be expected to be of the order of a few seconds, becoming many minutes at -40 \(^\circ\text{C}\) and below. Data acquired in these conditions should therefore be used with caution.
As is typical of chilled mirror instruments, the GE data mirror data become ambiguous between 0 \(^\circ\text{C}\) and -30 \(^\circ\text{C}\) in which range it is often difficult to distinguish the phase of the condensate layer. This is important since ice and water have different saturation vapour pressures at a given temperature. To put it another way, for a given ambient humidity level, the dew and frost points will be different by a known, non-trivial amount. Since it is not obvious whether the mirror temperature reported is a frost or a dew point, the true ambient humidity cannot be determined from the mirror temperature alone. Supercooled liquid water typically only has lifetimes of tens of minutes on the GE mirror, and below -40 \(^\circ\text{C}\) homogenous freezing will occur. FAAM have not seen instances of a GE liquid water layer below -30 \(^\circ\text{C}\). Careful examination of the data by the user may therefore be required with this instrument to distinguish the mirror phase and therefore the true ambient humidity.
No correction is made for pressure. There is no pressure measurement within the GE inlet or sample chamber. For there to be flow through the inlet there must be a small reduction in the pressure in the inlet below ambient static pressure. Although small, this is unknown.
GE dewpoint measurements can be positively biased in cloud, as the sampling method appears to allow cloud water into the sample chamber which then floods the mirror.
This instrument is no longer routinely calibrated. Dewpoint data from the Buck CR2 chilled mirror hygrometer should be used instead where possible. Where Buck CR2 data is unavailable, data from the General Eastern may be used, but only after careful comparison between the Buck and General Eastern for preceding flights.
Buck CR2
The Buck CR2 hygrometer measures atmospheric dewpoint using the chilled mirror technique. There are currently two Buck CR2 units at FAAM, serial numbers 211-M and 219-M, but it is only possible to fit one at a time to the aircraft. The CR2-211-M was first fitted to the aircraft in August 2008 and was used intermittently until January 2016, when the CR2-219-M was fitted in its place. Several problems have been detected with both instruments and both have been returned to the manufacturer for repair and modification several times.
Air is extractively pumped through an inlet into a sample chamber and passed over a mirror-like metal surface. The mirror temperature is regulated using a Stirling cycle cooler until condensation begins to form on the mirror, this being the dew or frost point in the chamber. The condensation layer is maintained at a constant level using optical detection and control, and the mirror temperature is measured using an embedded platinum resistance thermometer or thermistor.
The CR2 sample inlet consists of a pumped reverse-facing inlet and outlet mounted around 1.8 m back from the nose of the aircraft. The inlet pipes are made of stainless steel and are linked to the CR2 instrument by a stainless steel line with an internal hydrophobic coating. The sample line is heated to 50 \(^\circ\text{C}\) to increase the mobility of adsorbed water. The CR2 is mounted around 60 cm from the inlet, within the aircraft skin compartment. Data are transmitted using an RS232 link. Power for the CR2, pump and heater, and conversion from RS232 to ethernet are catered for in an auxiliary electronics unit. The sample mass flow is controlled to 1 litre per minute by means of a downstream flow controller and pump. The CR2 outputs measurements of its mirror temperature data at 1 Hz, along with other state parameters used to define the stability of the mirror condensation layer. The uncorrected mirror temperature is included in the core file as parameter TDEW_CR2
Both CR2 instruments have been seen to exhibit “cold-soaking”. This occurs when the aircraft descends rapidly from high altitude into warmer, moist air. The metal optics block has a high thermal mass and thus warms up slowly in comparison to the air flowing through the chamber. It is thought that condensation occurring on the window between the mirror chamber and the optics “blinds” the instrument. It can no longer “see” what is happening on the mirror, so assumes the mirror needs to be cleaned, and performs a heating and cooling cycle accordingly. This results in unusable data and is a common problem in detachment flying at hot locations. To address the issue, a heater surrounded by insulation has been wrapped around the outside of the optics block of the CR2-219-M, which solved the problem. The same heater has been implemented on the CR2-211-M but it was removed by the manufacturer during a repair and has yet to be reinstated.
WVSS-II
The WVSS-II was designed for commercial air carriers by UCAR/SpectraSensors, and it is possible to fit up to two units on the FAAM aircraft at windows 6 and 7. Two types of inlet are available, the most commonly used being a purpose-built certified UCAR inlet on the aircraft skin which removes liquid water from the sample stream, to improve measurements in cloud. Although low-profile it is potentially susceptible to icing and has no heater, and this low-profile itself may be problematic, promoting measurement from within the aircraft boundary layer. The other type of inlet is a modified Rosemount Type 102 inlet, mounted on a short pylon to locate its mouth 12 cm from the skin, believed to place it outside the aircraft’s boundary layer. It has been shown that the modified Rosemount Type 102 inlet is susceptible to ingesting cloud particles.
A measurement is made just inside the aircraft with a tuneable diode laser (TDL) absorption technique using a single wavelength at 1.37µm and a 24 cm path length with \(2^{nd}\) harmonic detection. Volume mixing ratio data is reported approximately once every 2.3 s, and is interpolated to 1 Hz in the core processing to produce parameters WVSS2F_VMR_U and WVSS2R_VMR_U, for the flush and Rosemount inlets, respectively (or WVSS2F_VMR and WVSS2R_VMR prior to the introduction of the WVSS-II calibration described in section ref{wvss2cal}). FAAM have three WVSS-II units, serial numbers 4229. 0388 and 4252. 4252 is currently fitted using the flush inlet at window 6 and is the only unit for which an in-flight calibration analysis has been completed (see section ref{wvss2cal}).
Humidity calibration equipment in FAAM labs
Prior to 2019, the two Buck CR2 units were routinely sent to NPL for calibration. More recently, a calibration facility has been set up in the FAAM labs so that aircraft hygrometers can be calibrated in-house. The lab equipment consists of a Michell Instruments PSD2 pressure swing drier, a Michell Instruments DG2 dew point generator, and an MBW 973-L transfer standard chilled mirror hygrometer. Tubing from the PSD2 to the DG2 and on to the MBW 973-L and test hygrometers is stainless steel of internal diameter \(\frac{1}{4}\) inch or 6 mm.
Calibration
Calibration of lab equipment
The MBW 973-L hygrometer is calibrated yearly at NPL to achieve traceability to ITS-90, with calibration points at no more than 20 \(^\circ \text{C}\) intervals between -70 and +20 \(^\circ\text{C}\). The NPL calibration certificate states:
“The calibration was carried out against NPL Standard Humidity Generators, in terms of dew-point temperature. The ‘generated dew point’ was determined from measurements made using platinum resistance thermometers (PRTs). Traceability of the measurement was provided by calibration of these thermometers to the International Temperature Scale of 1990 (ITS-90) through NPL Temperature Standards.
Before use, the hygrometer mirror was cleaned successively with deionised water, isopropyl alcohol and then again with deionised water using cotton buds. Following each cleaning the mirror enclosure was dried in a stream of clean dry air.
Air of a known dew-point temperature, at a pressure of 105.0 kPa, was supplied to the test hygrometer inlet. At dew-point temperatures below 0 \(^\circ\text{C}\) a 1.3 m length of 3 mm internal diameter stainless steel tubing was used. At dew-point temperature above 0 \(^\circ\text{C}\) a 1.2 m length of 4 mm internal diameter PTFE tubing was used. The moist air was then vented to atmosphere, through a rotameter with a needle valve assembly for flow control. The air flow rate was set so that the flow through the test hygrometer was nominally 0.5 litres per minute, as measured by an additional rotameter on the exhaust of the hygrometer.
The measurement procedure was as follows: (a) the temperature of the thermostatically controlled NPL Generator bath containing a primed saturator was set (b) air was circulated through the pipework and the NPL Generator system was allowed to come to equilibrium (c) the hygrometer mirror was cleared of condensate which was then allowed to re-form (d) the RS232 output of the test hygrometer was monitored until the instrument was seen to have stabilised.
At the conclusion of the final step of the above procedure a set of ten readings was then taken over a period of at least 20 minutes.”
The NPL calibration data is used to generate a calibration curve which is applied to the MBW 973-L output.
Calibration of Buck CR2
The calibration by comparison of the Buck CR2 units is done in a similar way to the NPL calibration described above. In this case, the DG2 is used to generate a flow of air of a fixed dewpoint, which is split between the MBW 973-L and the instrument under test. The flow rate through each instrument is between 0.5 and 1 litres per minute, as measured by the MBW 973-L itself and by a rotameter on the exhaust of the Buck CR2. As for the NPL calibration, the test hygrometer mirror is cleaned beforehand. For each calibration point, which are no more than 20 \(^\circ\text{C}\) intervals between -50 and +20 \(^{\circ}\text{C}\), the instruments are allowed to stabilise before readings of mirror temperature are recorded over no less than 10 minutes for mirror temperatures below -25 \(^{\circ}\text{C}\), and no less than 5 minutes at temperatures above -25 \(^{\circ}\text{C}\). These readings are logged over RS232 for each instrument, and a mean and standard deviation calculated for each calibration point.
Should the above calibration show a lack of agreement within uncertainty between the MBW 973-L and the Buck CR2, a calibration curve is generated and applied to the Buck CR2 output in processing. Prior to 2021, when one of the Buck CR2 units have not agreed within uncertainty with a calibrated instrument (either at NPL or FAAM), this has been due to a fault with the Buck CR2 (in particular a leak which allows lab air into the chamber, increasing the frost point below -40 \(^{\circ}\text{C}\)) and not a calibratable drift, and so a calibration curve was typically not required. During calibration of the Buck CR2-211-M in August 2021, a calibration curve was found to be required, correcting the reported mirror temperature by up to 0.5 \(^{\circ}\text{C}\).
Data processing
(See p_rio_buck.py [FAAM, n.d.] and p_buck.py [FAAM, n.d.])
Converting Buck CR2 mirror temperature to volume mixing ratio
The core processed data for the Buck CR2 includes the mirror temperature and the volume mixing ratio of water vapour. Prior to September 2016, the water vapour pressure was calculated using the parameterisation given by Hardy (1998) [Hardy, 1998], which is based on the ITS-90 formulations. In September 2016, v004 of the core data processing was updated to use the Murphy and Koop (2000) [D. M. Murphy, 2005] parameterisation for water vapour pressure. The saturation vapour pressure over liquid water is now calculated according to
valid for \(123<T<332\) K. The saturation vapour pressure over ice is calculated as follows:
valid above 110 K. The water vapour pressure inside the instrument, \(e_{H_2O,Buck}\), is calculated using either equation eq:pliq or eq:pive depending on whether a dew point or a frost point has been observed. Above 273.15 K, a dew point is clearly observed. Below 243.15 K, we can be confident that a frost point is being measured. Between 243.15 and 273.15 K, a dew point is assumed if the mirror has not been below 243.15 K since it was last above 273.15 K and it has been below 273.15 K for less than ten minutes. If the mirror temperature is within the supercooled water regime but has been below 243.15 K since it was last at 273.15 K, or it has been below 273.15 K for more than ten minutes, a frost point is assumed. The fact that these are assumptions is reflected in the measurement uncertainty, described in section ref{uncertainty}.
The vapour pressure is converted to volume mixing ratio, \(w_{H_2O}\), in units of ppm, as follows:
where \(f\) is the relevant enhancement factor [1] given by Hardy (1998) [Hardy, 1998] for either liquid water or ice, \(p_{Buck}\) is the air pressure inside the instrument, and \(e_{H_2O,Buck}\) is the vapour pressure calculated from the reported mirror temperature calculated using equation (14) or (15). This volume mixing ratio is reported as parameter VMR_CR2 in the core file.
Pressure correction to Buck CR2 dew and frost points
A corrected dew point or frost point of the air outside the aircraft is included in the core data file (parameter TDEWCR2C), which is slightly different to the mirror temperature (approximately 0.2 to 0.6 K higher). This is due to the pressure inside the hygrometer being slightly lower than the outside air pressure since air is drawn through the instrument by a downstream pump. Unlike the General Eastern, the Buck CR2 measures its internal pressure, allowing for a correction to be applied. This correction takes the volume mixing ratio calculated in equation (16) and converts it to a water vapour pressure for air outside the aircraft:
where \(p\) is the static air pressure from the RVSM system in Pa, and \(r_{H_2O}\) is the volume mixing ratio from equation (16) expressed as a ratio (rather than ppm). A dew or frost point is then calculated using the Murphy and Koop (2005) parameterisation. Frost points are calculated using an equation given in the paper:
In the absence of an equation to calculate dew point, a numerical solving routine is used to find \(T_{dew,outside}\) from equation (14).
Uncertainty in Buck CR2 data
The uncertainty associated with the Buck CR2 measurements have several sources, which are summed in quadrature:
The uncertainty associated with the lab calibration, either performed at NPL or at FAAM using the MBW 973-L transfer standard, calibrated at NPL. This is derived from the NPL expanded uncertainty and fit to a power law: \(u(c) = 0.02 + 5\cdot10^{27} T_{mirr}^{-12.5}\)
The repeatability of the calibration. This is derived from the NPL calibration measurements of different dew points and fit to a power law: \(u(r) = 0.01 + 4\cdot10^{19} T_{mirr}^{-9}\)
The response time of the instrument and the atmospheric variability. This is based on an assessment of the standard deviation of subsequent readings over a relevant timescale to give an indication of atmospheric variability. Above 248 K, that relevant timescale is taken to be 8 s. Below 248 K, the timescale is calculated according to \(\text{lag} = 2\cdot10^{29} T_{mirr}^{-11.902}\). The standard deviation in mirror temperature for the relevant timescale before and after each datapoint is found, and the maximum of these two standard deviations is use as the uncertainty associated with the response time, \(u(t)\).
The uncertainty involved in the interpolation of data between calibration datapoints. This is a function of temperature: above 233.15 K, it is 0.025 K; below 233.15 K it is calculated according to \(u(i) = -0.0044 T_{mirr} + 1.051\)
The possible bias, \(u(b)\), associated with the uncertainty about whether there is water or ice on the mirror between 243.15 and 273.15 K. This is calculated using a flagging scheme according to the temperature history of the mirror. If the flagging scheme highlights that there is doubt around whether supercooled water or ice has formed on the mirror, the mirror temperature is used to calculate the saturation vapour pressure over water (using the Magnus forumla for water), and this saturation vapour pressure is then used to calculate the frost point (using the Magnus formula for ice). The difference between this frost point and the mirror temperature is \(u(b)\)
These are combined to produce an uncertainty value for the mirror temperature for each datapoint, parameter TDEW_C_U, which is used to calculate an upper and lower bound for the volume mixing ratio, producing an uncertainty parameter VMR_C_U. In v004 of the post processing, this uncertainty was reported as an expanded uncertainty with coverage factor \(k=2\). In v005, for consistency with other uncertainty parameters, it is reported as a combined uncertainty, which can be doubled by the user for a coverage factor \(k=2\) and coverage probability of approximately 95%.
Calibration of WVSS-II and associated uncertainty
(See p_wvss2_cal [FAAM, n.d.])
Although the Buck CR2 has the advantage of being an absolute measure of water vapour traceable to national standards, it is slower to respond to atmospheric changes than the WVSS-II. As well as this, the Buck CR2’s mode of operation means that fluctuations in the mirror temperature are not an accurate representation of how the water vapour in the atmosphere is changing in the short term. As with all chilled mirror hygrometers, it continually increases and decreases its mirror temperature to determine the point at which a layer of condensate forms. For large changes in dewpoint in particular, this can cause an overshoot and subsequent oscillations which do not reflect real changes in water vapour concentration. The WVSS-II, on the other hand, uses an absorption spectroscopy technique, measuring the absorption due to water vapour in the path of its laser beam. This means that changes in the concentration that the WVSS-II reports are directly caused by atmospheric variation, and so its time response provides a more accurate representation of the true water vapour variation than the Buck CR2.
Unfortunately, it is not straightforward to calibrate the WVSS-II, especially in the lab. The instrument reports volume mixing ratio, but its measurement (i.e. the absorption of the laser beam due to water vapour) is dependent on water vapour pressure. To produce its water vapour mixing ratio data, some unknown internal calculations are performed using the instrument’s air pressure measurement. To thoroughly calibrate the WVSS-II, therefore, it would be necessary to make measurements across the water vapour pressure and air pressure range of interest. In the FAAM labs, it is not possible to generate a flow of fixed dewpoint air at the pressures encountered in flight (nor is NPL, at present, able to calibrate our MBW 973-L transfer standard at reduced pressure). In the absence of a more satisfactory alternative, we use the Buck CR2 as a calibration source for the WVSS-II by comparison in flight.
This calibration by comparison with the Buck CR2 has been done using data from 21 flights in 2020 when the SN 4252 unit was fitted at window 6 and the Buck CR2 219-M was fitted and working well. The strategy, implemented in wvss2_calibration_v01.py [Price, n.d.] was as follows:
From the 21 flights’ worth of 1 Hz core data, remove (i) any measurements collected in profiles, (ii) any measurements where the RH is greater than 95%, and (iii) 10 minutes of measurements after the RH is above 95%. This is to avoid the effect of the Buck CR2 being slower than the WVSS-II (and thus the instruments reporting water vapour measurements for different altitudes during profiles), and to avoid issues caused by water ingress into either instrument. If either instrument reports three volume mixing ratios below 0 ppm, the following 20 minutes of data are removed from the comparison
The above step results in a dataset consisting of many chunks of data, separated by no data. It is now possible to assess whether each chunk is of sufficient duration to be an acceptable calibration point. What constitutes a sufficient duration is based on the stabilisation time of the Buck CR2 for the relevant mirror temperature seen in the lab during calibration. If a chunk is long enough, the average of the last 10 s is tested to see whether it could be considered a calibration point. If the standard deviation in the volume mixing ratio over those final 10 s is greater than 2% of the measured volume mixing ratio, the chunk is discarded. Otherwise, its mean is used as a calibration point
This results in a calibration dataset of WVSS-II vs Buck CR2 volume mixing ratio that can be fit with a cubic polynomial, using a least-squares fitting routine weighted by the uncertainty in the Buck CR2 “calibration point” (which is a combination of the average uncertainty in the Buck CR2 volume mixing ratio for the 10 s, and the standard deviation in the Buck CR2 volume mixing ratio in those 10 s). It was not found to be necessary to include a pressure dependency in the calibration.
Through the above steps a calibrated water vapour volume mixing parameter is created, WVSS2F_VMR_C, that has the time response of the flush-mounted WVSS-II SN 4252 on window 6, along with a link to the traceable calibration of the Buck CR2. This analysis will need to be repeated periodically to monitor for drift. It will also need to be redone for any other WVSS-II unit fitted to the aircraft.
The combined uncertainty associated with the calibration by comparison described above is a combination of three components: (i) the residuals in the cubic fit (calculated using a power law fit to the rolling maximum fractional residual magnitude), (ii) the minimum uncertainty in the Buck CR2 volume mixing ratio, and (iii) the uncertainty in the fit itself (the likelihood that the true fit to the data provided to the fitting routine lies within this bound). These three sources of uncertainty are summed in quadrature to produce the combined uncertainty in the calibrated flush-mounted WVSS-II, parameter WVSS2F_VMR_C_CU.
Relative humidity
(See p_wvss2_rh [FAAM, n.d.])
In the absence of a reliable relative humidity sensor on the FAAM aircraft, relative humidity must be calculated using independent temperature and water vapour measurements. At present (2021), the fastest core water vapour measurement is that of the flush-mounted WVSS-II, which is calibrated against the Buck CR2 chilled mirror hygrometer as described in section Calibration of WVSS-II and associated uncertainty. In the calculation of relative humidity, it is crucial to match water vapour measurements with temperature measurements corresponding to the same parcel of air. The data output from the WVSS-II is updated at a rate of approximately every 2.3 seconds: the internal measurement is made at 4 Hz, but the instrument collects 8 cycles of data (2 s) before doing computations and updating the output. The true air temperature measurements made in the Rosemount Type 102 housings are much faster and are reported at 32 Hz. To match a WVSS-II datapoint with a colocated temperature measurement therefore needs an appropriate lag applied to the temperature data, as well as some averaging.
The find out how long the lag is between the WVSS-II and temperature probe (i.e. the difference in time between the WVSS-II datapoint and its colocated temperature measurement), an analysis was performed (wvss2_temperature_lag_analysis.py [Price, n.d.]) using data from 95 flights in 2019 and 2020 when the unit SN 4252 was fitted to the flush inlet at window 6. In these flights there was a mixture of plate- and loom-type PRTs tested (a separate lag analysis being required for looms and plates because of their differing time responses). The raw WVSS-II data (prior to the usual interpolation to 1 Hz) was used in the analysis. Because each reported datapoint in the raw WVSS-II data is an average of 8 cycles (2 seconds), each temperature value to use should be the average of the 64 datapoints leading up to the colocated temperature measurement. This will not necessarily be the temperature measurement with the nearest timestamp, since the WVSS-II takes time to process and transmit data, meaning that the colocated temperature may be logged earlier than the WVSS-II measurement.
As the aircraft moves through the air, there will be sometimes be correlation between the absolute gradients in volume mixing ratio and temperature, and this can be used to determine the lag. For this lag analysis, each of the 95 flights were split into segments 50 WVSS-II datapoints long (approximately 2 minutes). For each segment, a set of 50 corresponding average temperatures is generated by finding the nearest temperature measurement in time to each WVSS-II datapoint, then averaging over the 64 temperature measurements prior. This process is repeated to generate another set of 50 average temperatures, but this time with a lag applied so that the 64 temperature measurements used for each datapoint are \(\frac{1}{32}\) s earlier. This is further repeated 320 times, with an incrementally ( \(\frac{1}{32}\) s) increasing lag for each, until 320 average temperature datasets have been created of different lags (i.e. shifting by \(\frac{1}{32}\) s over 10 s). For the WVSS-II dataset for the segment, and the 320 test average temperature datasets for each segment, the absolute gradients in volume mixing ratio and true air temperature, respectively, are calculated.
For each test dataset, the correlation coefficient between volume mixing ratio gradient and true air temperature gradient are calculated. The maximum correlation coefficient for the segment should correspond to the best estimate of the lag. Good estimates of lag are considered to be where this maximum correlation coefficient is greater than 0.7. Where this requirement is satisfied, the lag is recorded, otherwise the segment is discarded. Once all segments in all flights have been analysed, the mean of all of the calculated lags for each type of temperature sensor are found, as well as the standard deviation in those means. The lag to apply to loom true air temperature data was found to be \(2.00\pm0.88\) s; the lag to apply to plate true air temperature data was found to be \(1.63\pm1.57\) s.
In calculating the relative humidity, v005 of the post processing code preferentially uses the true air temperature from the de-iced Rosemount Type 102 housing, TAT_DI_R. The uncertainty associated with TAT_DI_R is described in section Combined uncertainty in static air temperature, but in the calculation of relative humidity there is another contributing factor: the uncertainty that comes from trying to match together colocated temperature and water vapour measurements. The lag analysis described above gives an estimate of the lag, with a standard deviation, and so we use this to calculate upper and lower limits of the lag, and subsequently the upper and lower limits of the 2 s smoothed temperature. The uncertainty in temperature due to the uncertainty in lag is then taken to be the greater (in magnitude) of the difference between the upper limit of temperature and the temperature found using the best estimate of the lag, and the difference between the lower limit of temperature and the temperature found using the best estimate of the lag. In other words, the lag-associated uncertainty in the temperature to use at each datapoint is taken to be the greater of the absolute difference between the temperature to use and the temperature that is the average of the 2 s prior to the upper and lower estimates of lag.
The uncertainty in the temperature that will contribute to the uncertainty in relative humidity is the summation in quadrature of the uncertainty in the true air temperature calculated as described in section Combined uncertainty in static air temperature, \(u(T_{core})\), and the uncertainty in temperature which comes from uncertainty in the lag applied, \(u(T_{lag})\):
The water vapour pressure, \(e'\), in Pa, is calculated from the calibrated WVSS-II volume mixing ratio (parameter WVSS2F_VMR_C), \(w\), in ppm, and the static pressure from the RVSM system converted to Pa (parameter PS_RVSM \(\times 100\)), \(p\):
The uncertainties in the water vapour pressure, \(u(e')\), calculated in this way have two sources: \(u(w)\), the uncertainty in the calibrated WVSS-II volume mixing ratio in ppm (parameter WVSS2F_VMR_C_CU), and \(u(p)\), the uncertainty in the RVSM static pressure in Pa (given by equation (5), multiplied by 100 to convert from mb to Pa).
The pure saturation vapour pressure, \(e_{s,liq}\) and \(e_{s,ice}\), is again calculated according to Murphy and Koop (2005), using equations (14) and (15).
The temperature to use here is the 2 s averaged, lag-applied temperature calculated to be colocated with each WVSS-II datapoint. Uncertainties in these saturation vapour pressures are calculated as follows:
For brevity, the partial derivatives are not written out here but can be found in the v005 post processing code.
Now we multiply the pure saturation vapour pressures calculated above by the enhancement factors for each phase, to give the effective saturation vapour pressures, \(e_s'\):
where \(e_{s,liq,T>273}'\) is the effective saturation vapour pressure over liquid water above 273 K, \(e_{s,liq,T<273}'\) is the effective saturation vapour pressure over supercooled water, and \(e_{s,ice}'\) is the effective saturation vapour pressure over ice. The corresponding enhancement factor for each phase, \(f\) is calculated as described by Hardy [Hardy, 1998] for each phase of water, ranging from 1.001 to 1.005 for the conditions in which FAAM flies.
Hyland [Hyland, 1975] estimates the percentage maximum uncertainty in calculated enhancement factor at 1 bar (no data is provided at lower pressures) as 0.01, 0.03, 0.04, 0.05, 0.06% at 30, 10 , -10,-30 and -50 \(^{\circ}\text{C}\), respectively. There will also be uncertainty in \(f\) due to the uncertainty in \(p\), \(T\) and \(e_s\), as follows:
When these are all calculated, and summed in quadrature with the uncertainty estimated by Hyland [Hyland, 1975], this gives uncertainties in \(f\) between 0.00025 and 0.00065. This is negligible in comparison with the contribution to the uncertainty in RH from the uncertainty in the vapour pressure and the uncertainty from temperature, so instead of lengthy calculations in the post processing code we use the upper limit of 0.00065.
The relative humidity over each phase of water is calculated as follows:
These are parameters RH_LIQ and RH_ICE in the core file.
The uncertaintise in the two relative humidities, parameters RH_LIQ_CU and RH_LIQ_CU, are calculated using:
which becomes:
where the \(RH\), \(e'\), \(f\) and \(e_s\) are calculated as appropriate for the relevant phase of water.
Fig. 8 and Fig. 10 show the relative contributions of each term in equation (17) for two different flights, with data from these two flights shown in Fig. 9 and Fig. 11. It can be seen that the terms associated with uncertainty in vapour pressure and saturation vapour pressure are the largest, while the contribution from the uncertainty associated with the enhancement factor is negligible. Comparing Fig. 8 and Fig. 9, with Fig. 10 and Fig. 11, respectively, illustrates the variability in the uncertainty in relative humidity, and the contributing factors. Depending on the conditions encountered, the uncertainty in saturation vapour pressure (which comes from uncertainty in temperature) can be more or less important than the uncertainty in vapour pressure (which comes mostly from the uncertainty in the WVSS-II volume mixing ratio). Uncertainty in relative humidity is generally highest when WVSS-II volume mixing ratio is low, as the relative uncertainty in that measurement increases as volume mixing ratio decreases.

Fig. 8 Relative contributions of each term in equation (17) over the course of C128.
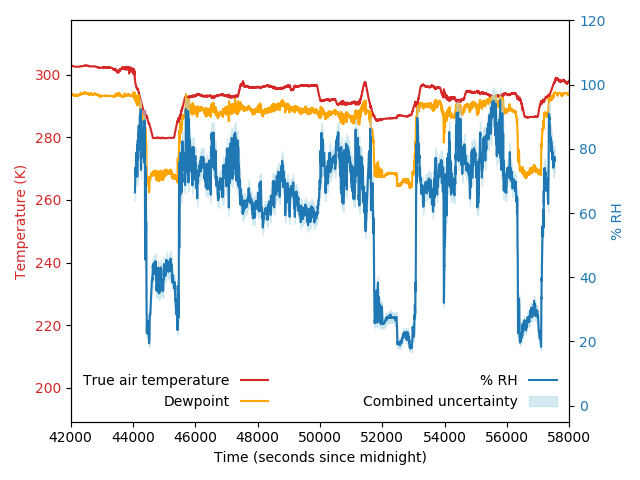
Fig. 9 Temperature and humidity data for C128.
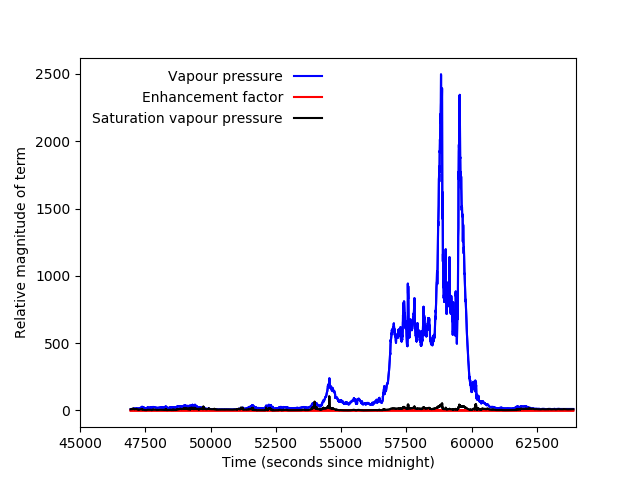
Fig. 10 Relative contributions of each term in equation (17) over the course of C213.
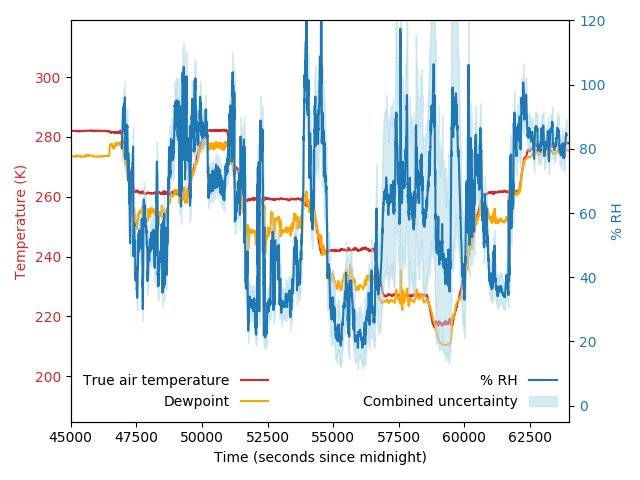
Fig. 11 Temperature and humidity data for C128.
Footnotes